refigure2 is an extension for Reinteract that allows the embedding of matplotlib plots. It does so with a syntax reminiscent of pylab, matplotlib's procedural (MATLAB™-like) interface. refigure2 is a spiritual successor to refigure, though the two share little code and less syntax.
Other extensions embed matplotlib figures in Reinteract, but refigure2 has three notable features:
with block in order to operate on a single figure.Keyboard control, custom rc files, and some bug fixes:
matplotlibrc file, refigure2 will read rc settings from files named refigurerc in the same directory as refigure2.py, in ~/.matplotlib, and (if you are using the output patch) in the notebook directory, in that order.
figure.figsize and figure.subplot.bottom on load. It does not respect settings for them in matplotlibrc, but it does respect those settings in refigurerc.refigurerc files have the same format as a matplotlibrc file, with three additional settings:
refigure.printdpi sets the DPI for printed figures when using the bitmap printing method. It defaults to 300.refigure.keyboardcontrol sets whether the figure can grab keyboard focus when clicked and respond to keypress events. Defaults to True.refigure.disableoutput sets whether output should be disabled by default inside with figure() blocks. Defaults to False, meaning output is printed. (This is a change from 0.3, where output was not printed by default.) Output printing may still be adjusted on per-figure basis with the disable_output keyword.from refigure2 import * doesn't pollute your namespace as much.Several bug fixes and improvements:
rcParams['savefig.dpi'], so bump that up to get good results.The locking mechanism has been fixed.
Initial release.
Download the single .py file. Place it in your ~/.reinteract/modules folder, which you may need to create. (It can also go in the reinteract/lib folder of your Reinteract installation, or somewhere else on your sys.path.)
refigure2 is hosted at github, so if you want to hack it, you can clone the repository git://github.com/rschroll/refigure2.git
Import the refigure2 module. For interactive work, I find it much easier to import it into the current namespace. refigure2 tries to avoid unnecessary namespace pollution.
from refigure2 import *
You'll almost always want numpy as well:
from numpy import *
Single pylab commands† can be given alone, to create simple plots:
plot([1,2,3])
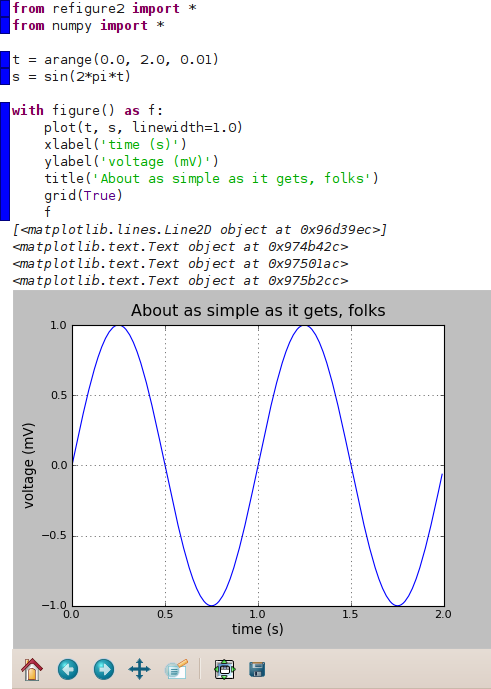
Multiple pylab commands can be grouped together in a with block.
with figure() as f:
    plot([1,2,3])
    ylim(0,5)
    title('Plot title')
    f
refigure2 requires the use a GTK-based backend. If you use another backend by default, refigure2 will attempt to select an appropriate GTK backend. Should you wish to override this choice, include these commands before importing refigure2:
from matplotlib import use
use('GTKAgg')('GTK' or 'GTKCairo' may be used instead.)
More details can be found in the refigure2 tutorial [.tar.gz|.zip].
† Most of the pylab commands work in refigure. ginput() is known not to work; others may also fail. show() and draw() don't work, but they aren't needed. figure() works differently in refigure than in matplotlib; see the tutorial for details.
Bugs will be tracked on the github issue tracker.
ginput() is known not to work. Other functions may also fail — please report them.
Settings made in rcParams leak between open worksheets, even if they're not part of the same notebook. This is because modules are singletons in Python. Therefore, all open worksheets share the same refigure2 object, which contains rcParams. Reinteract must be completely closed to reset these settings (or you can manually tweak rcParams). I don't know if this is fixable within refigure2. As a work-around, rclocal can be used to adjust rcParams for the current figure only.
refigure2 is known to work with versions 0.98.5.2–0.99.1.1 of matplotlib. Please let me know if it works (or doesn't) with other versions of matplotlib.
Robert Schroll, rschroll at gmail dot com